Power Rankings
Every team ranked by a rating fit on results — who beat whom, by how much, and how surprising it was — with an offseason pull toward average (NBA: plus a preseason adjustment for roster moves, from last season's player ratings). No polls, no votes, no opinions. It is the same rating our season simulations run on, so this table and the championship odds cannot disagree about who is good. Projected standings for the full season are on the NHL and NBA season predictions pages.
NFLNFL Power Rankings — Week 8
108 games · updated Oct 30Movement is versus the previous week: the same rating re-run with those results removed. Rec # is where the standings put the team; a gap between that and the rank is the model disagreeing with the table.
| # | Δ | Team | Record | PD | Last 5 | Elo | Rec # | Proj W | Playoffs | Super Bowl |
|---|---|---|---|---|---|---|---|---|---|---|
| 1 | — | Buffalo Bills AFC East | 5-1 | +26 | 4-1 | 16450 | 4 | 12.0 | 90.5% | 11.6%+0.9 |
| 2 | — | Seattle Seahawks NFC West | 4-3 | +43 | 2-3 | 16410 | 14↑ | 10.5 | 74.1% | 8.0%+2.3 |
| 3 | — | Minnesota Vikings NFC North | 6-0 | +51 | 5-0 | 16370 | 1 | 12.9 | 95.8% | 13.2%+1.4 |
| 4 | — | Denver Broncos AFC West | 5-2 | +3 | 4-1 | 16250 | 7 | 11.5 | 87.1% | 9.1%+2.2 |
| 5 | — | San Francisco 49ers NFC West | 6-1 | +58 | 4-1 | 16170 | 2 | 12.2 | 95.0% | 10.4%-5.3 |
| 6 | — | Jacksonville Jaguars AFC South | 4-2 | +50 | 3-2 | 16070 | 9 | 11.1 | 87.4% | 7.4% |
| 7 | — | New England Patriots AFC East | 4-3 | +17 | 3-2 | 15780 | 15↑ | 9.8 | 66.5% | 4.2%-1.8 |
| 8 | — | Chicago Bears NFC North | 5-2 | +37 | 4-1 | 15750 | 5 | 10.3 | 64.5% | 3.9%+1.0 |
| 9 | — | Los Angeles Rams NFC West | 3-4 | +11 | 2-3 | 15680 | 17↑ | 8.6 | 33.2% | 2.1%+0.6 |
| 10 | — | Detroit Lions NFC North | 4-2 | +19 | 3-2 | 15650 | 11 | 10.1 | 65.3% | 4.0%+0.9 |
| 11 | — | Pittsburgh Steelers AFC North | 5-2 | +15 | 4-1 | 15640 | 6 | 10.7 | 71.8% | 4.7%+1.5 |
| 12 | — | Cincinnati Bengals AFC North | 4-2 | +41 | 3-2 | 15630 | 10 | 10.8 | 75.2% | 4.5%+2.1 |
| 13 | — | Kansas City Chiefs AFC West | 5-1 | +40 | 4-1 | 15570 | 3↓ | 10.9 | 83.6% | 5.1%-1.5 |
| 14 | — | Green Bay Packers NFC North | 5-3 | +7 | 4-1 | 1543+13 | 13 | 9.1 | 42.0% | 1.7%-0.9 |
| 15 | — | Baltimore Ravens AFC North | 4-3 | +2 | 3-2 | 15140 | 16 | 8.9 | 35.3% | 1.3%-2.0 |
| 16 | — | Houston Texans AFC South | 2-5 | -5 | 2-3 | 15100 | 23 | 7.3 | 21.4% | 0.9%-0.8 |
| 17 | — | Atlanta Falcons NFC South | 3-4 | -2 | 3-2 | 14860 | 19 | 7.8 | 38.2% | 1.3%+0.7 |
| 18 | — | Tampa Bay Buccaneers NFC South | 2-5 | +11 | 2-3 | 14740 | 22 | 6.9 | 26.8% | 0.7% |
| 19 | — | Dallas Cowboys NFC East | 3-4 | +9 | 2-3 | 14670 | 18 | 8.0 | 41.3% | 1.1%+0.5 |
| 20 | — | Cleveland Browns AFC North | 5-2 | -13 | 4-1 | 14670 | 8↓ | 9.8 | 57.2% | 1.4% |
| 21 | — | New York Giants NFC East | 4-2-1 | +2 | 3-1-1 | 14570 | 12↓ | 8.5 | 48.1% | 1.2%+0.5 |
| 22 | ▲1 | Philadelphia Eagles NFC East | 2-5 | -48 | 0-5 | 14440 | 27 | 6.5 | 17.2% | 0.5%-1.0 |
| 23 | ▼1 | Carolina Panthers NFC South | 3-4 | -15 | 2-3 | 1436-13 | 21 | 7.6 | 34.1% | 0.8%-1.5 |
| 24 | — | Los Angeles Chargers AFC West | 0-6 | -61 | 0-5 | 14150 | 32↑ | 4.4 | 0.8% | 0.0% |
| 25 | — | Indianapolis Colts AFC South | 2-5 | -26 | 2-3 | 14140 | 25 | 6.3 | 8.6% | 0.1% |
| 26 | — | New Orleans Saints NFC South | 2-5 | -32 | 1-4 | 14090 | 26 | 6.2 | 13.7% | 0.3% |
| 27 | — | Washington Commanders NFC East | 1-4-1 | -40 | 1-3-1 | 14060 | 29 | 5.6 | 6.9% | 0.2% |
| 28 | — | Las Vegas Raiders AFC West | 3-4 | -14 | 1-4 | 13960 | 20↓ | 6.8 | 9.5% | 0.1% |
| 29 | — | Miami Dolphins AFC East | 1-5 | -59 | 1-4 | 13860 | 30 | 4.9 | 2.2% | 0.0% |
| 30 | — | Arizona Cardinals NFC West | 2-5 | -66 | 1-4 | 13730 | 28 | 6.0 | 3.8% | 0.1% |
| 31 | — | New York Jets AFC East | 2-5 | -13 | 1-4 | 13610 | 24 | 5.3 | 2.2% | 0.0% |
| 32 | — | Tennessee Titans AFC South | 1-6 | -48 | 1-4 | 13090 | 31 | 3.9 | 0.7% | 0.0% |
Where the model disagrees with the standings
- Seattle Seahawks 4-3 — #14 in the standings, #2 here (+43 points, Elo 1641). The record understates them.
- Cleveland Browns 5-2 — #8 in the standings, #20 here (-13 points, Elo 1467). The record flatters them.
- Kansas City Chiefs 5-1 — #3 in the standings, #13 here (+40 points, Elo 1557). The record flatters them.
NFLNFL Lineup of the Week — Week 7
Oct 22–Oct 26 · 14 gamesOne player per position — the best single-game line of the week at each spot: offence by PPR points, defence by a standard IDP score. Straight from the box scores — nothing here is a pick or a projection.








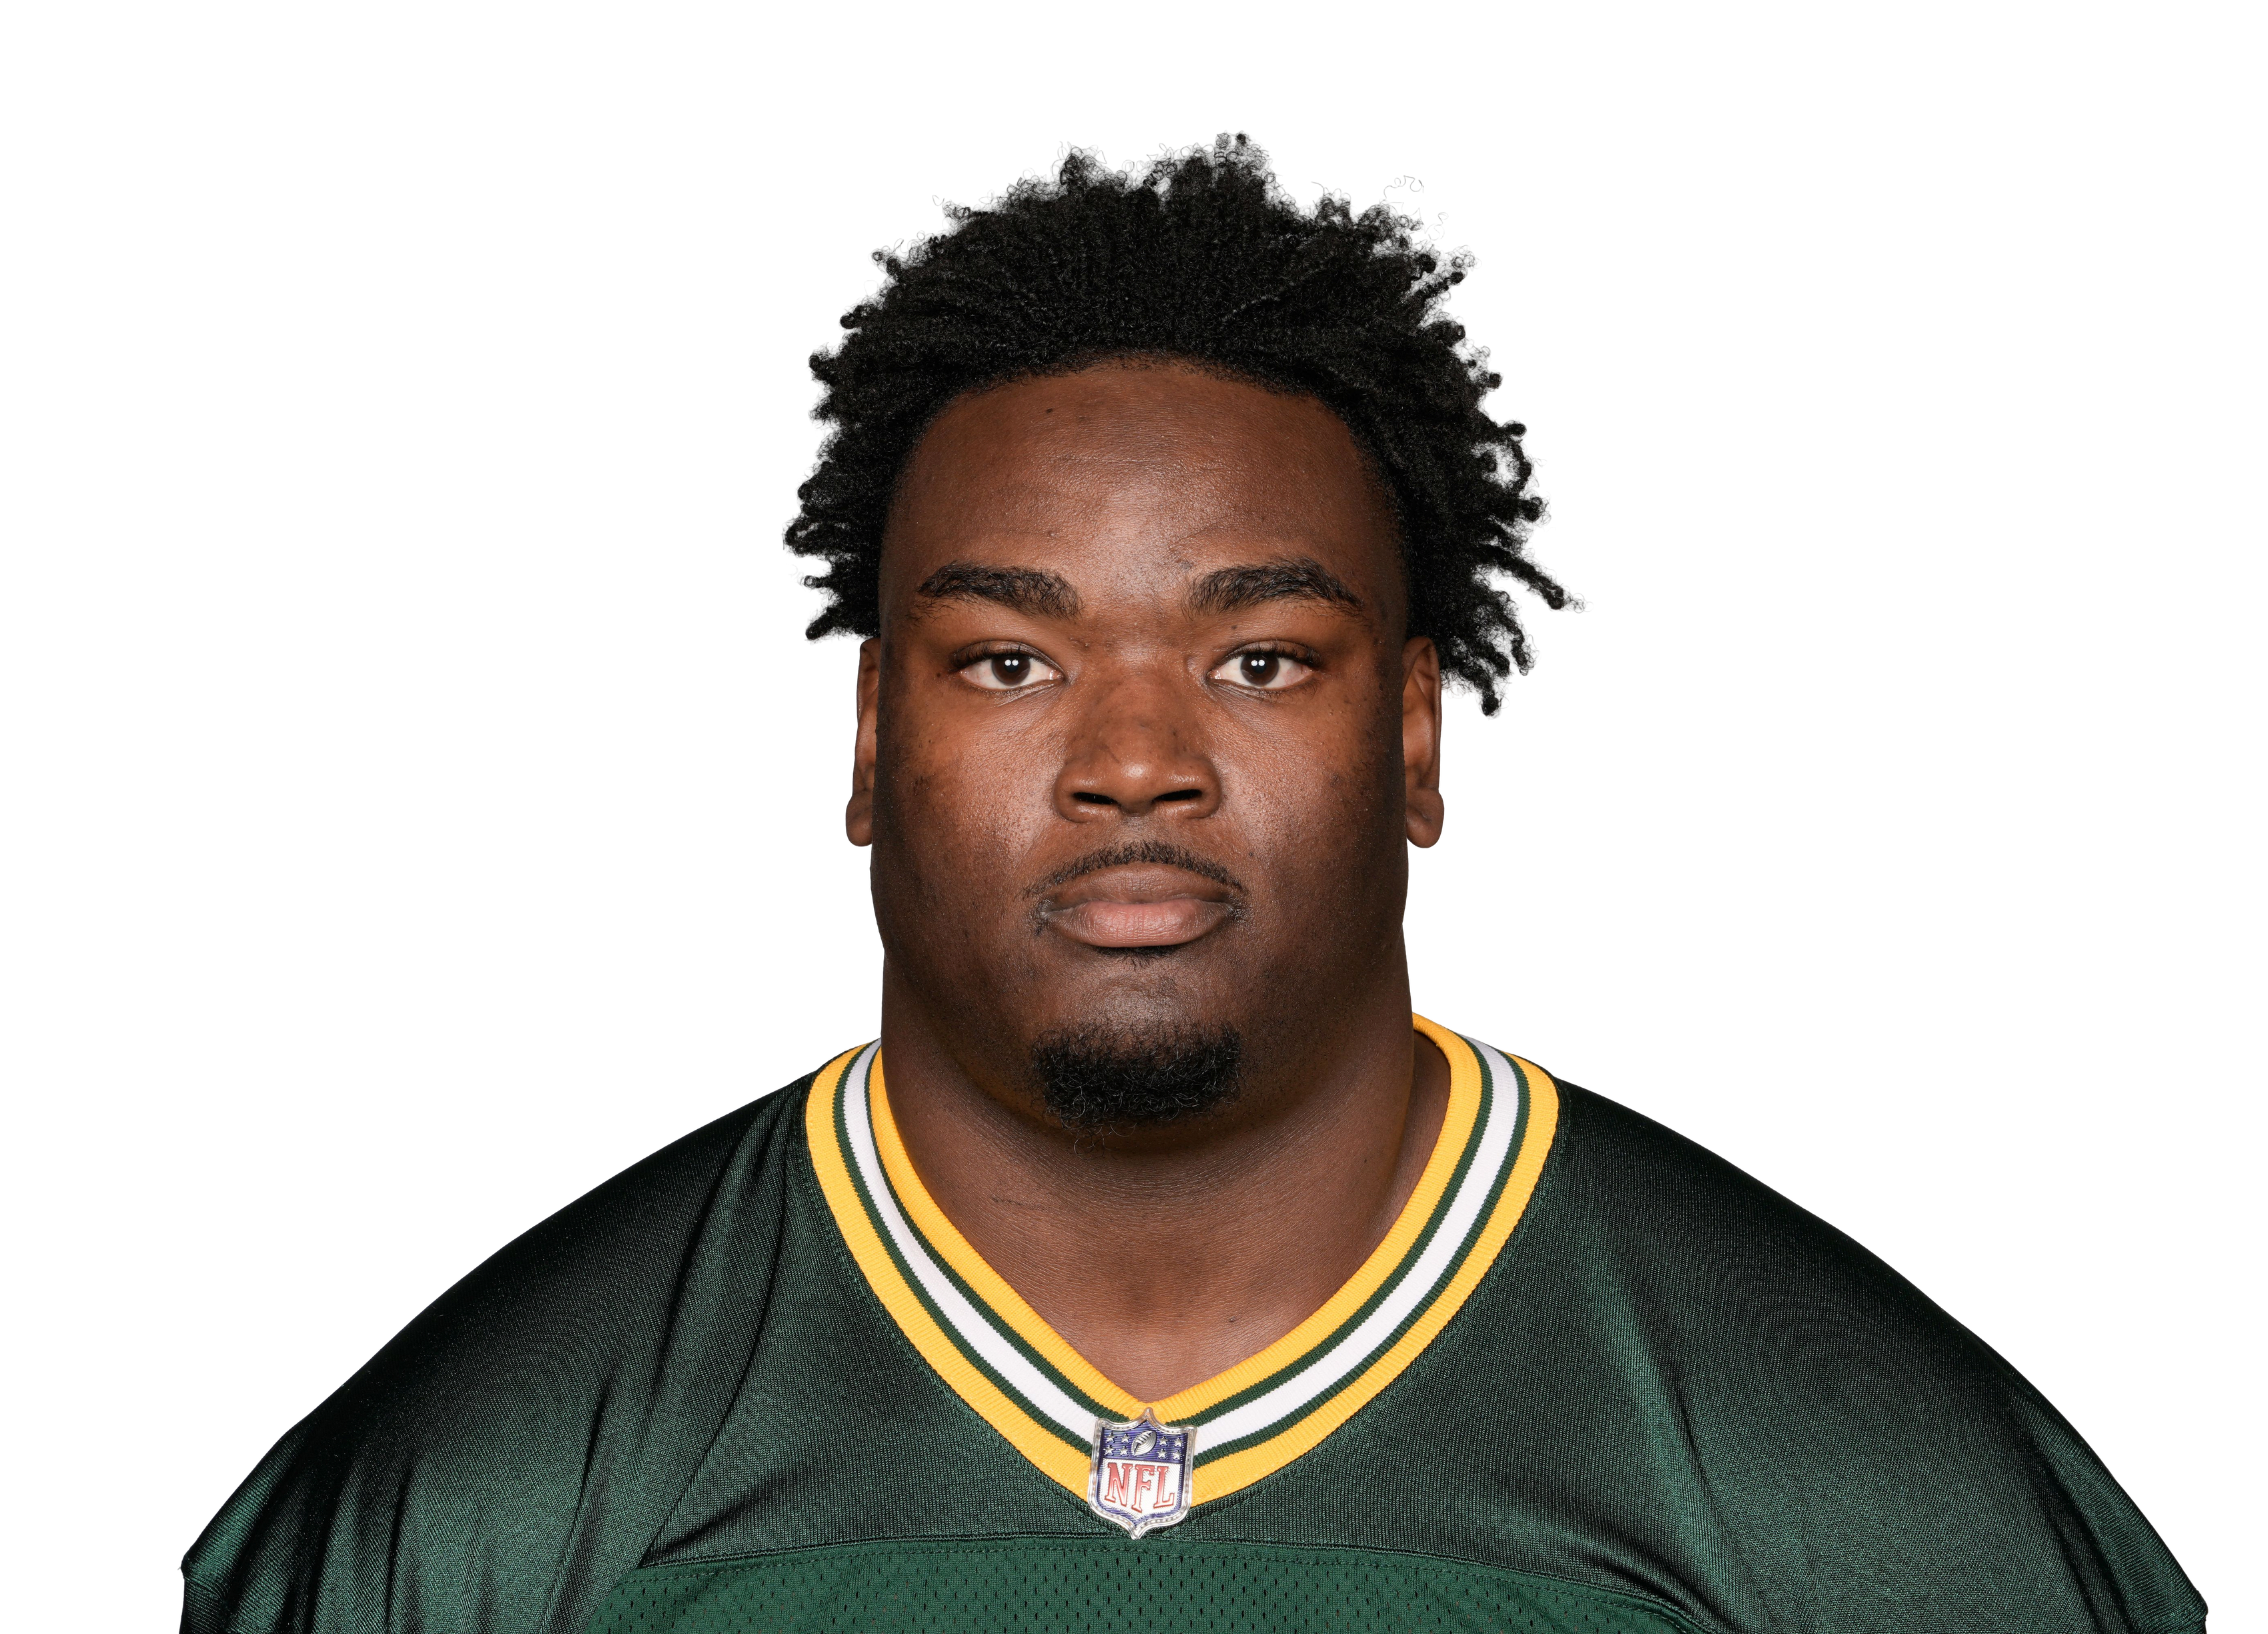




Division Players of the Week
| Division | Offense | Defense |
|---|---|---|
| AFC East |  Drake Maye NE 24/31, 321 yds, 2 TD, 1 INT, 26 rush yds, 1 rush TD |  Christian Elliss NE 13 tkl, 1 TFL |
| AFC North | Joe Burrow CIN 22/30, 292 yds, 4 TD, 0 INT |  Patrick Queen PIT 10 tkl, 1 TFL, 1 sk, 1 PD |
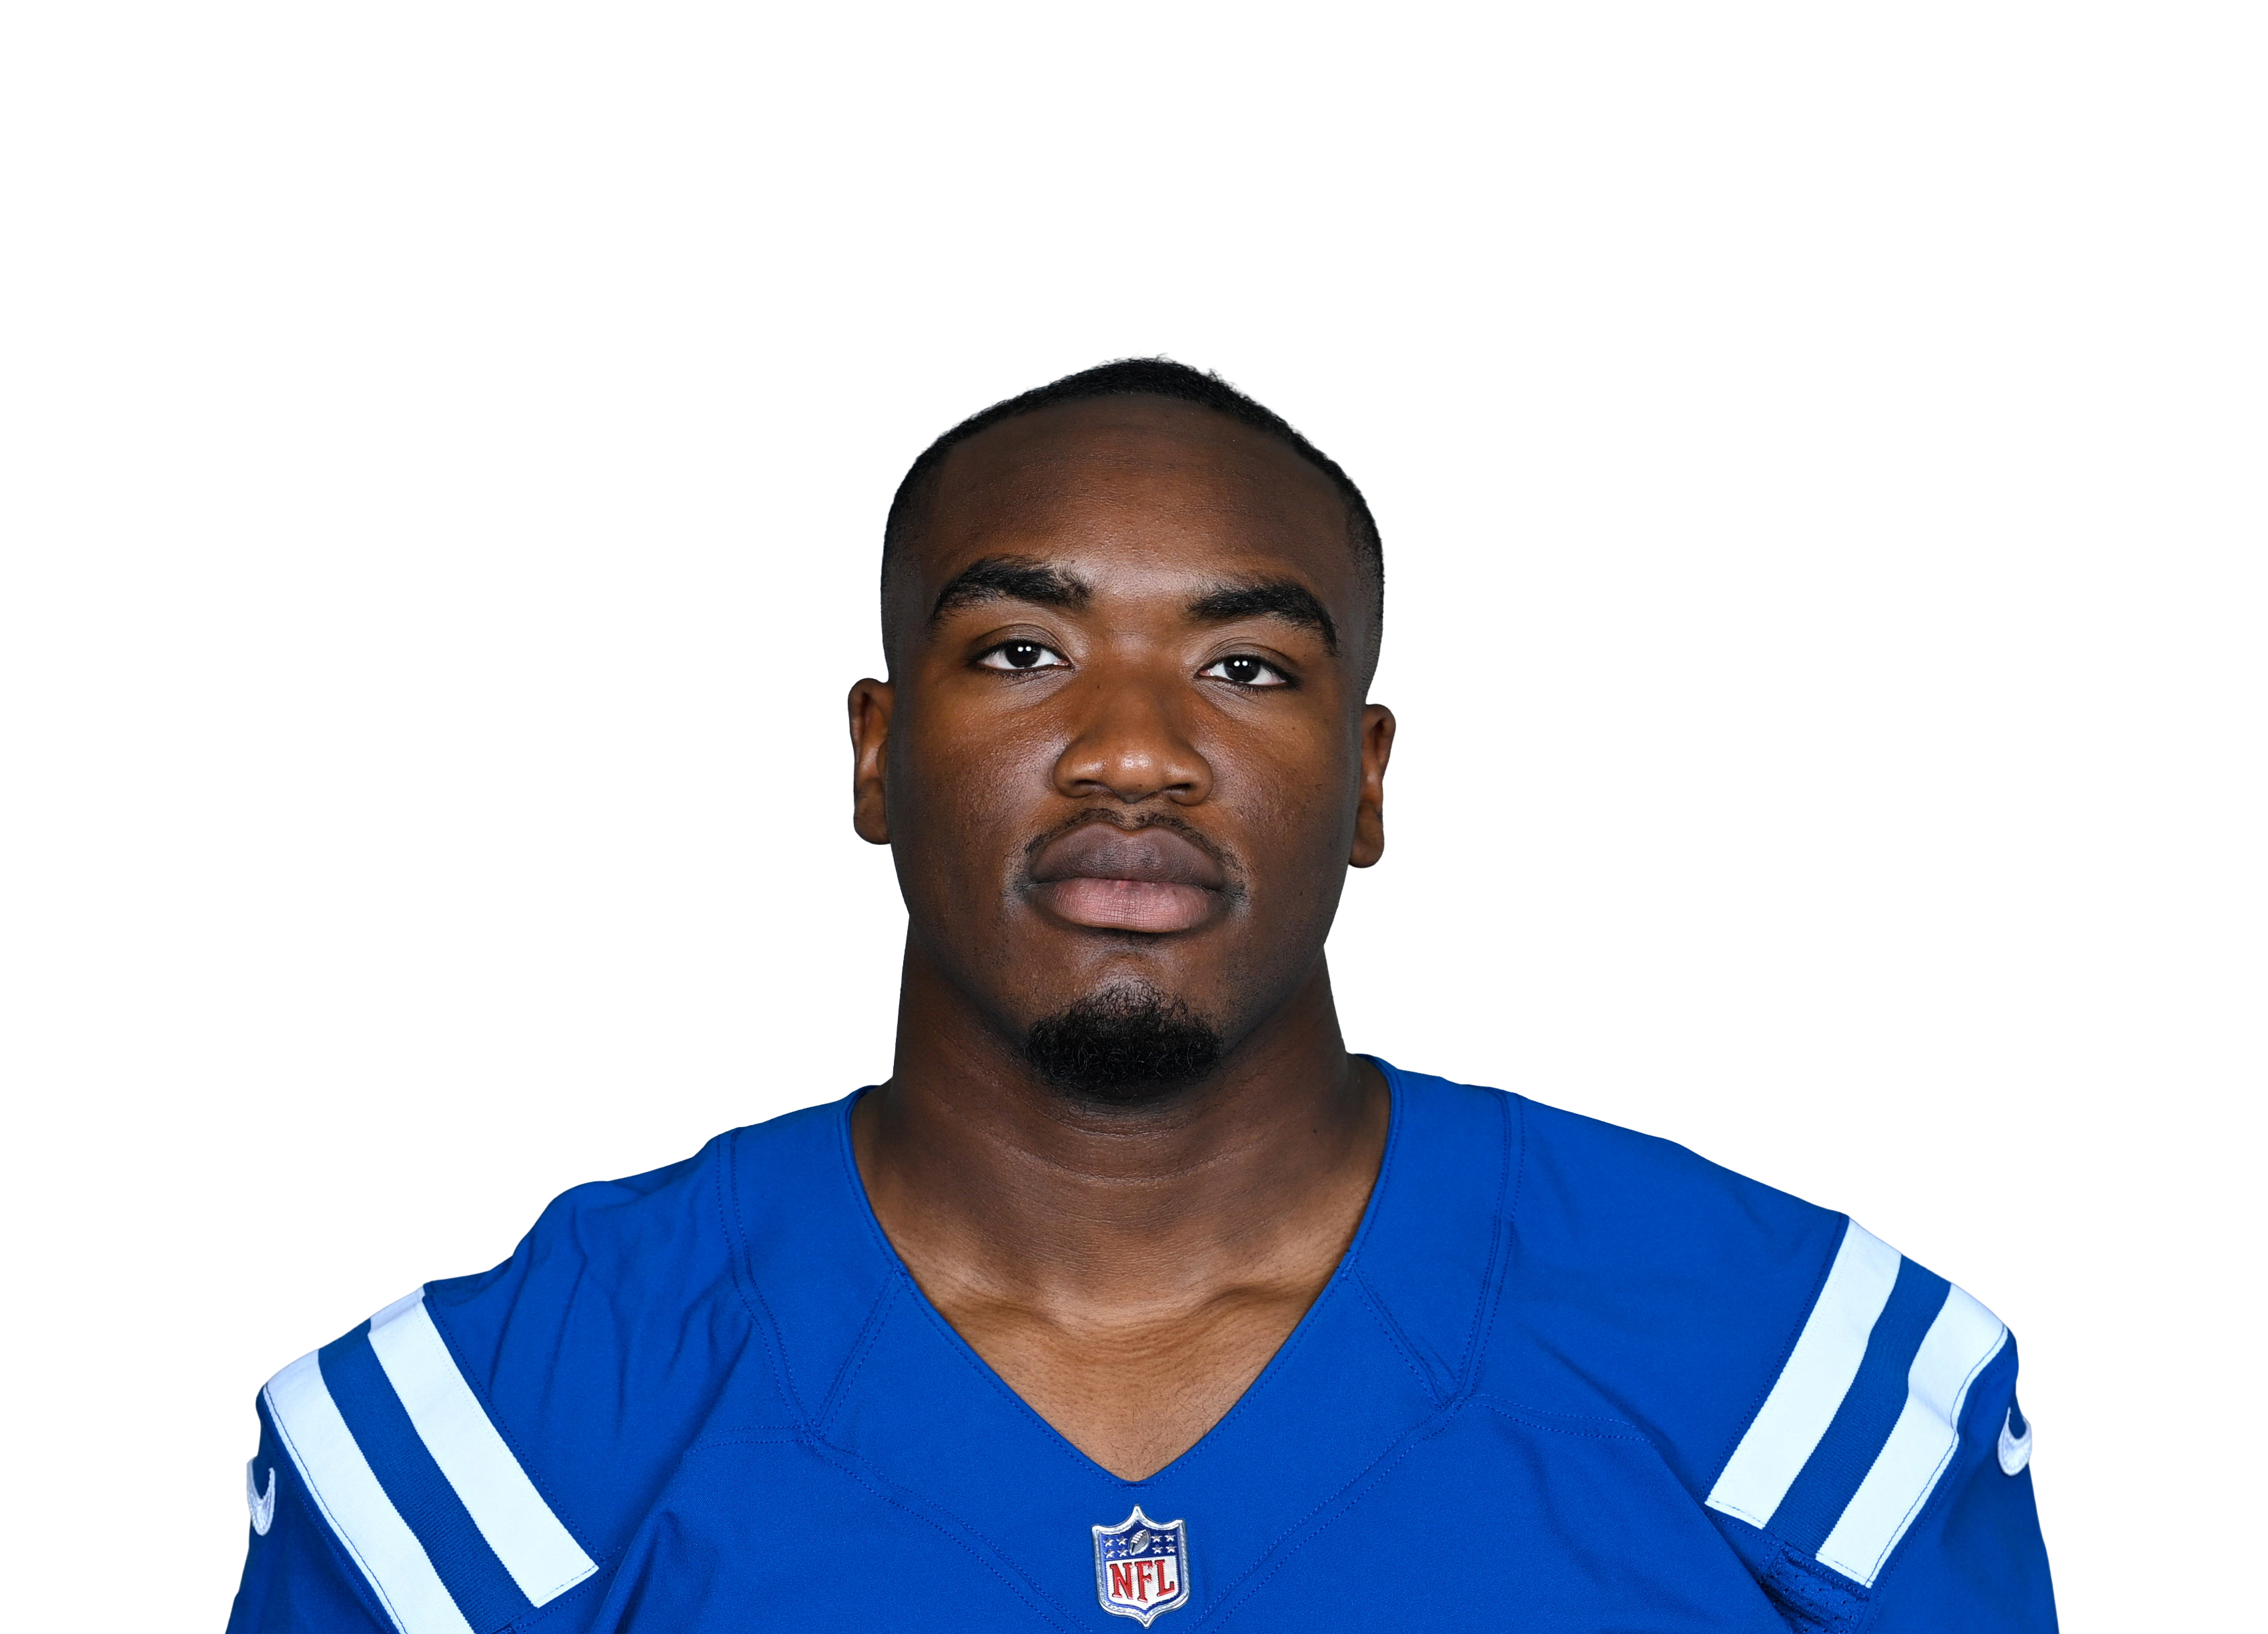
| AFC South | Tony Pollard TEN 25 car, 129 yds, 3 TD; 3 rec, 26 yds | Adetomiwa Adebawore IND 5 tkl, 2 TFL, 2 sk, 1 PD |
| AFC West |  Bo Nix DEN 15/29, 222 yds, 1 TD, 0 INT, 73 rush yds, 1 rush TD | Alex Singleton DEN 19 tkl, 1 TFL, 1 sk |
| NFC East |  CeeDee Lamb DAL 5/12, 74 yds, 2 TD |  Micah McFadden NYG 10 tkl, 2 TFL |
| NFC North | 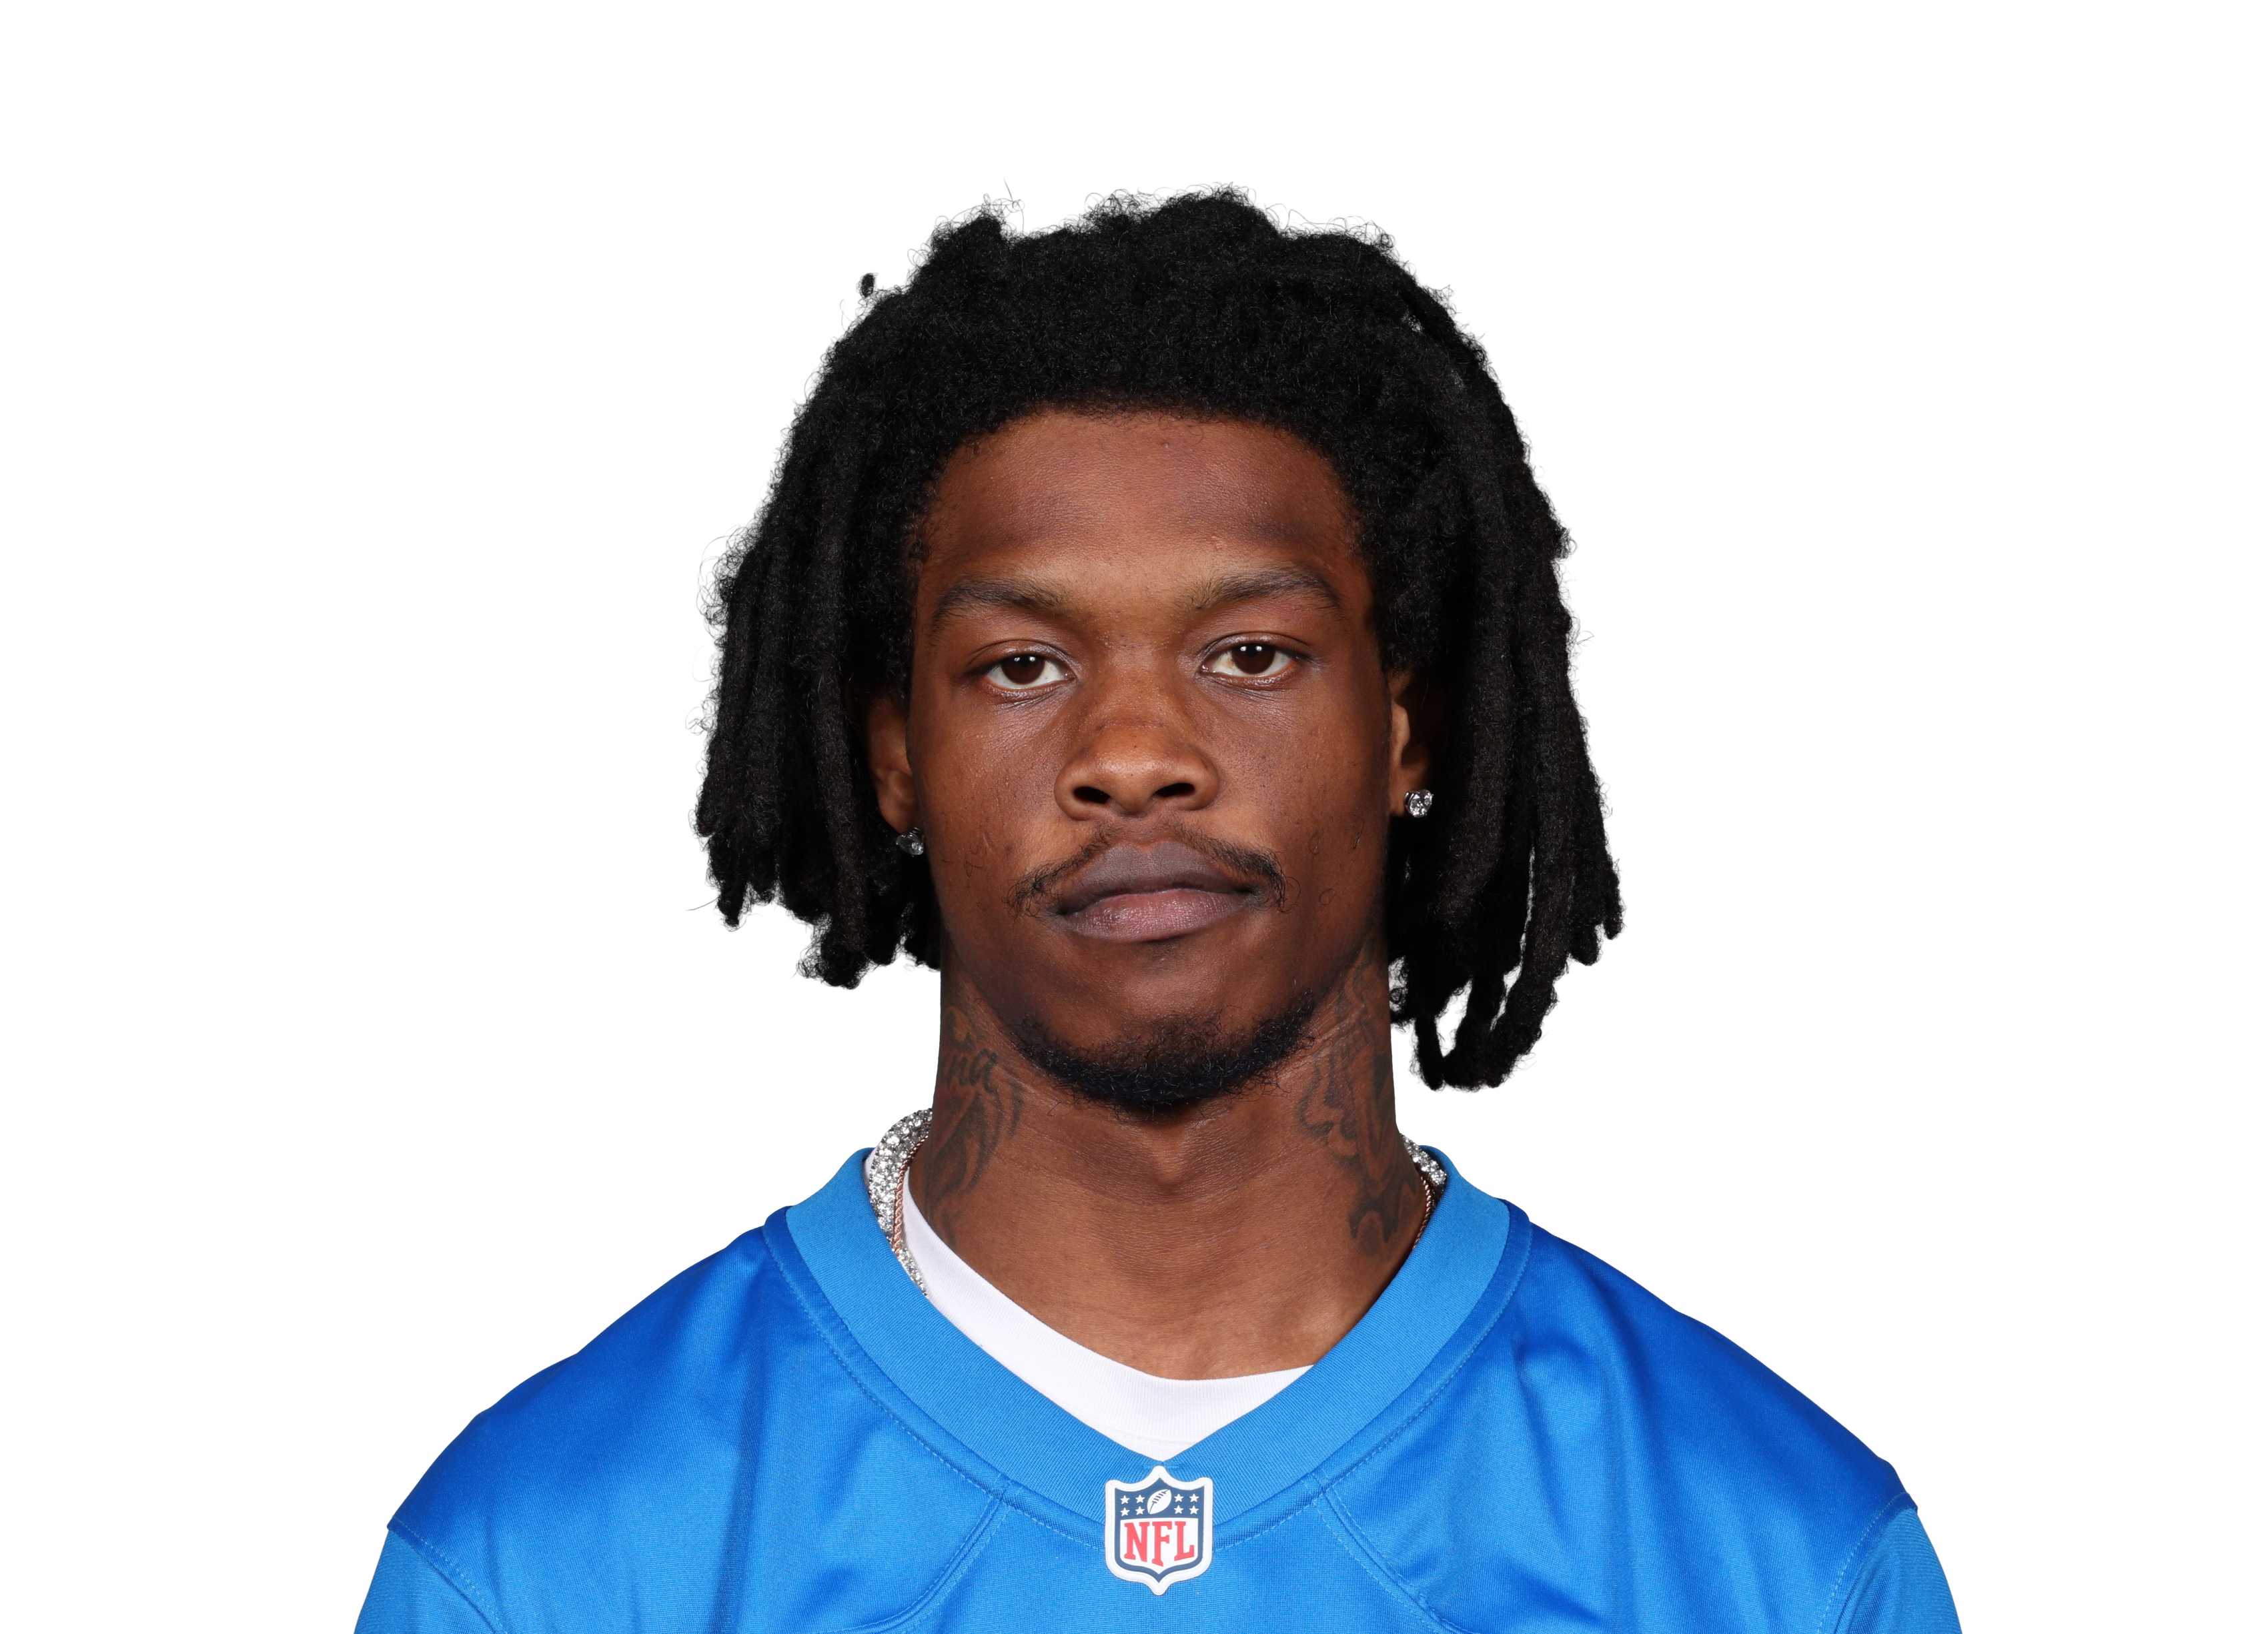 Jameson Williams DET 5/9, 91 yds, 2 TD | Blake Cashman MIN 12 tkl, 2 TFL, 2 sk, 4 PD |
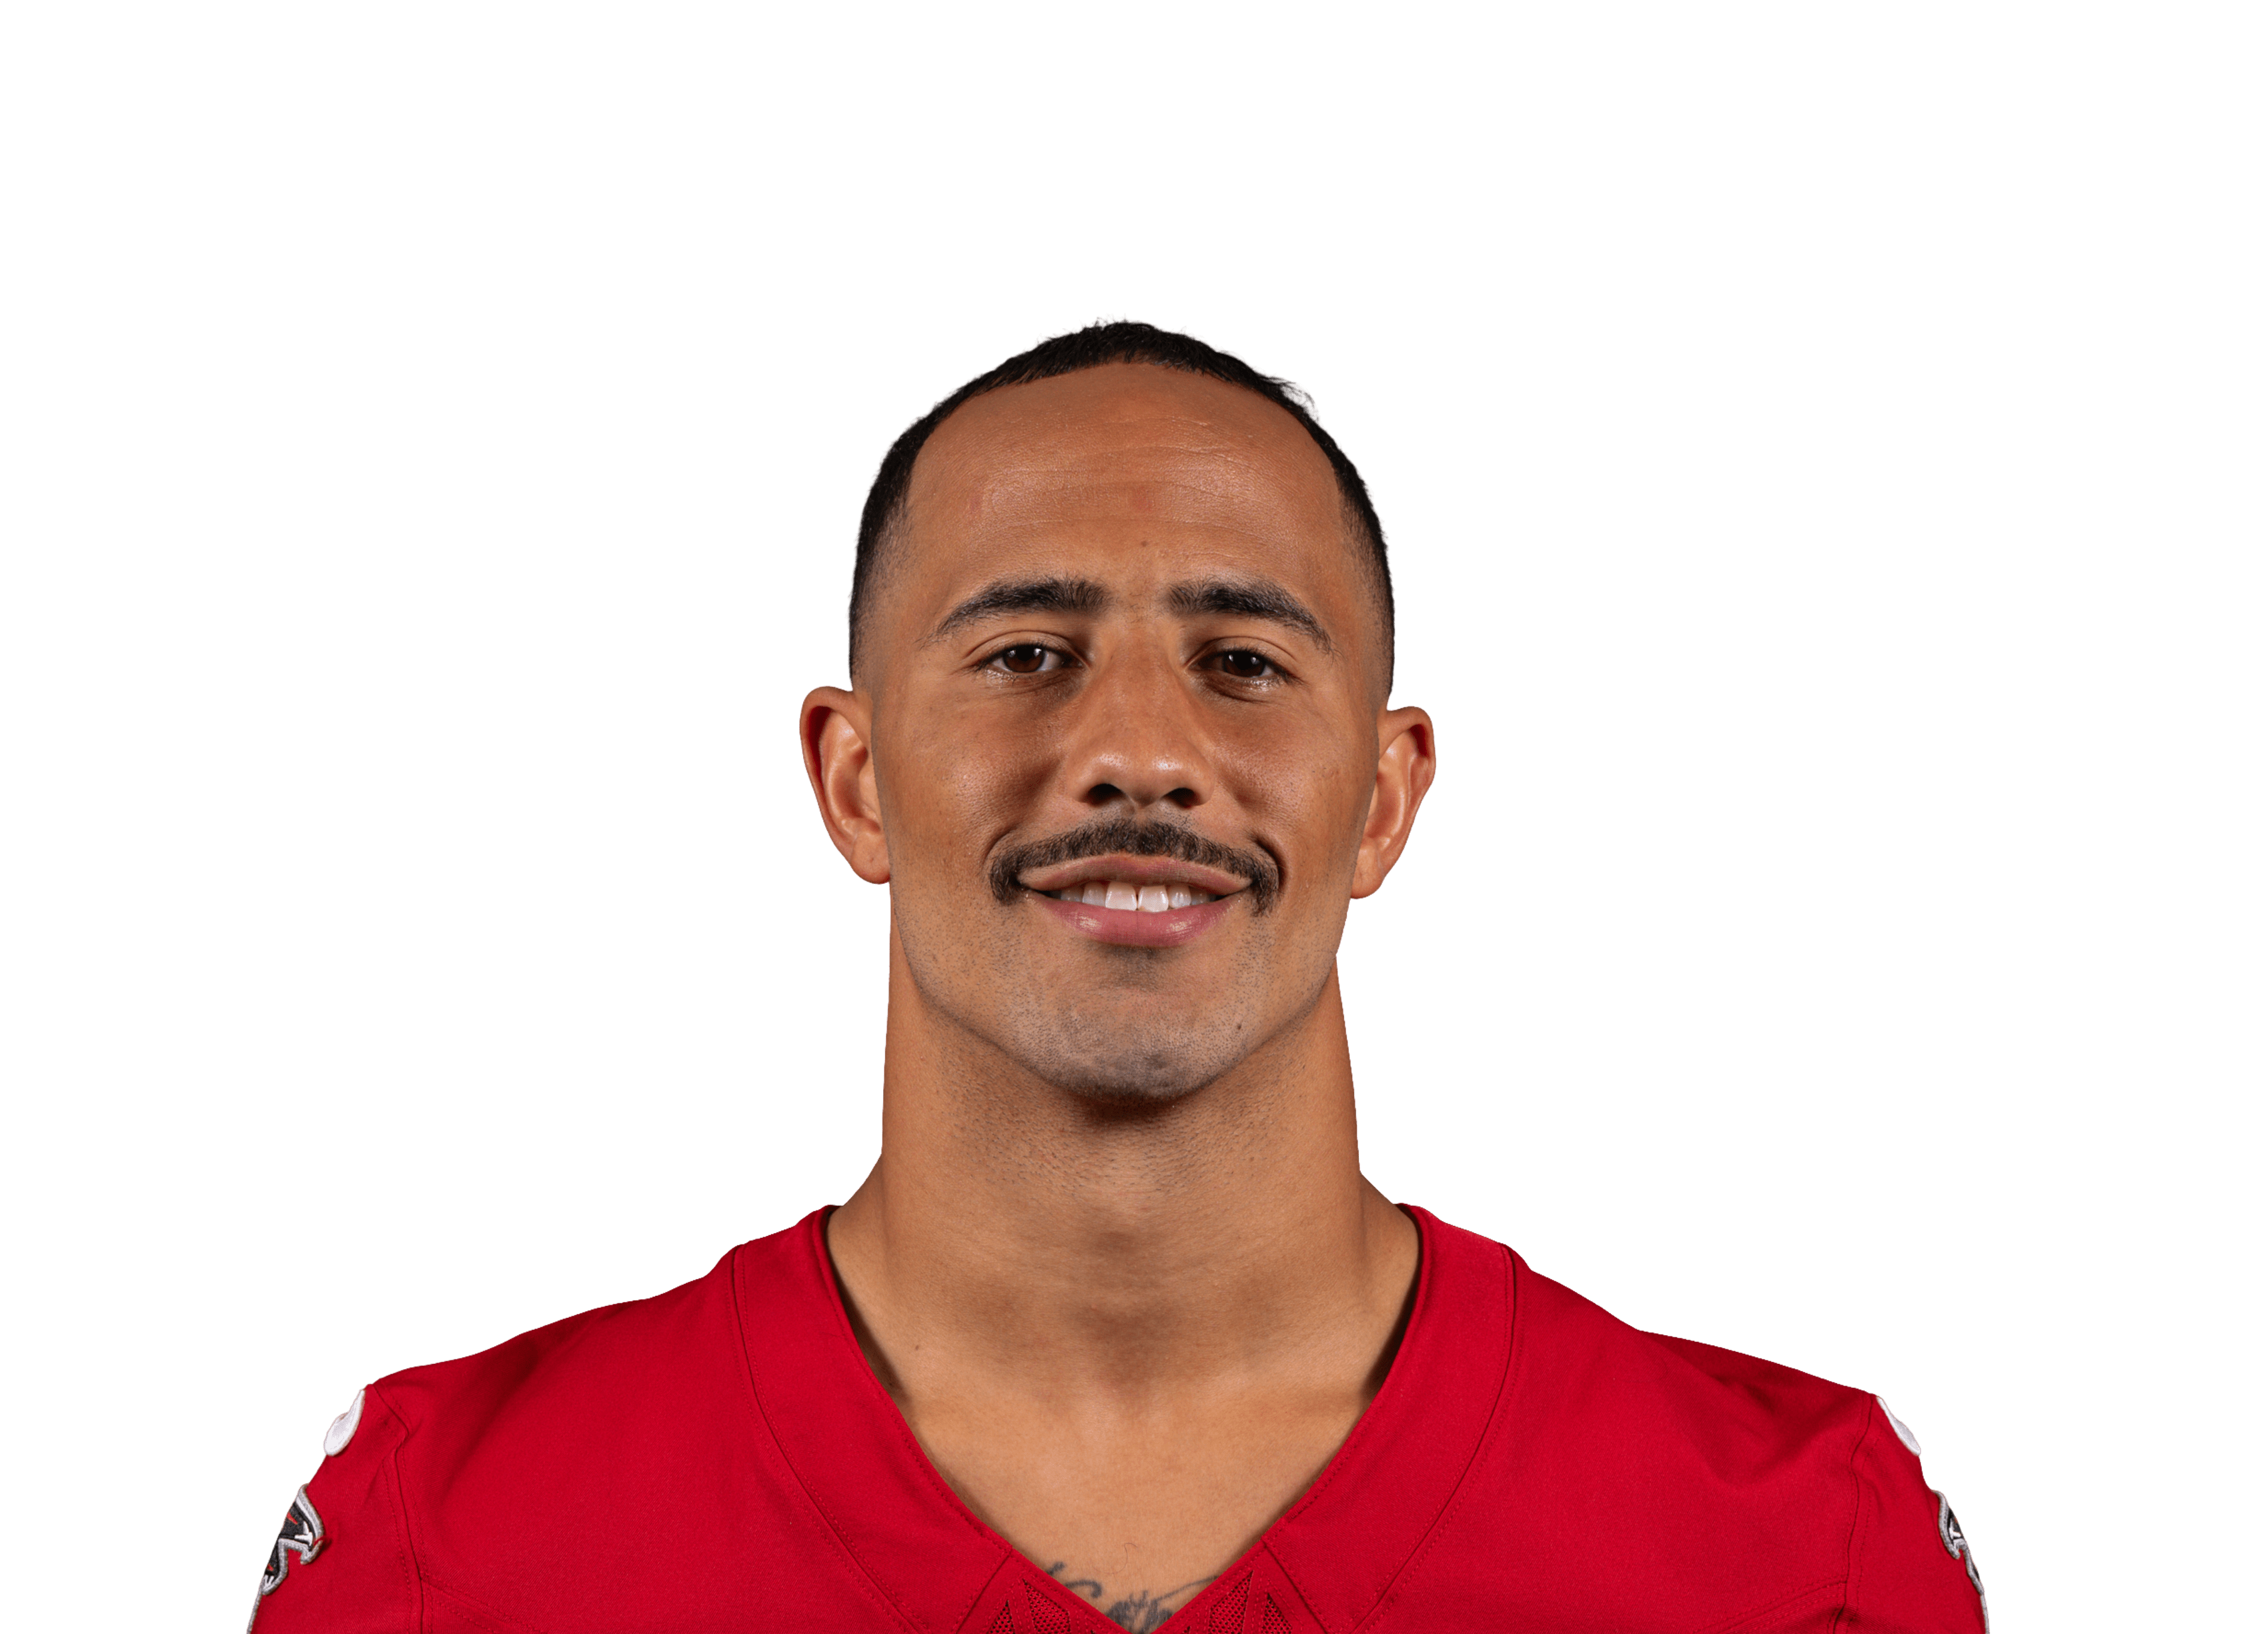
| NFC South | Bucky Irving TB 24 car, 106 yds, 2 TD; 1 rec, 4 yds |  Kendal Daniels ATL 11 tkl, 1 TFL, 1 INT, 1 PD, 1 FR |
| NFC West | Jaxon Smith-Njigba SEA 9/12, 150 yds, 1 TD |  Fred Warner SF 12 tkl, 2 TFL |
MLBMLB Power Rankings — Sep 27
2,429 games · updated Oct 29Movement is versus seven days ago: the same rating re-run with those results removed. Rec # is where the standings put the team; a gap between that and the rank is the model disagreeing with the table.
| # | Δ | Team | Record | RD | Last 10 | Elo | Rec # | Proj W | Playoffs | World Series |
|---|---|---|---|---|---|---|---|---|---|---|
| 1 | — | Milwaukee Brewers National League Central | 103-59 | +214 | 8-2 | 1579+6 | 1 | 103.0 | 100.0% | 24.8%+0.6 |
| 2 | — | Los Angeles Dodgers National League West | 100-62 | +201 | 8-2 | 1562+2 | 2 | 100.0 | 100.0% | 17.9%+0.6 |
| 3 | ▲1 | New York Yankees American League East | 93-68 | +138 | 5-5 | 1547+3 | 5 | 93.6 | 100.0% | 8.0% |
| 4 | ▼1 | Tampa Bay Rays American League East | 98-64 | +86 | 5-5 | 1544-1 | 3 | 98.0 | 100.0% | 14.3%-1.3 |
| 5 | ▲1 | San Diego Padres National League West | 91-71 | +41 | 8-2 | 1543+4 | 6 | 91.0 | 100.0% | 5.8% |
| 6 | ▼1 | Philadelphia Phillies National League East | 88-74 | +15 | 4-6 | 1536-4 | 8 | 88.0 | 100.0% | 4.1%+1.1 |
| 7 | — | Atlanta Braves National League East | 94-68 | +116 | 5-5 | 1532-6 | 4 | 94.0 | 100.0% | 4.3% |
| 8 | ▲1 | Boston Red Sox American League East | 87-75 | +78 | 5-5 | 1530-1 | 9 | 87.0 | 100.0% | 4.2% |
| 9 | ▼1 | Chicago Cubs National League Central | 89-73 | +147 | 5-5 | 1528-5 | 7 | 89.0 | 100.0% | 3.3% |
| 10 | — | Arizona Diamondbacks National League West | 86-76 | +9 | 6-4 | 1517+3 | 10 | 86.0 | 0.0% | 0.0%-0.5 |
| 11 | — | Cleveland Guardians American League Central | 85-77 | +11 | 8-2 | 1516+4 | 11 | 85.0 | 100.0% | 8.7% |
| 12 | — | Toronto Blue Jays American League East | 79-83 | -46 | 4-6 | 1507-5 | 18↑ | 79.0 | 0.0% | 0.0% |
| 13 | ▲1 | Houston Astros American League West | 81-81 | -32 | 5-5 | 1504+3 | 14 | 81.0 | 100.0% | 3.2%+0.6 |
| 14 | ▼1 | Pittsburgh Pirates National League Central | 82-80 | +28 | 7-3 | 1501-1 | 13 | 82.0 | 0.0% | 0.0% |
| 15 | ▲1 | Baltimore Orioles American League East | 79-82 | -21 | 6-4 | 1501+7 | 17 | 79.4 | 0.0% | 0.0% |
| 16 | ▲1 | Miami Marlins National League East | 80-82 | +3 | 5-5 | 1496+6 | 15 | 80.0 | 0.0% | 0.0% |
| 17 | ▼2 | Texas Rangers American League West | 80-82 | -46 | 4-6 | 1494-5 | 16 | 80.0 | 0.0% | 0.0%-0.5 |
| 18 | ▲1 | New York Mets National League East | 74-88 | -32 | 5-5 | 1490+1 | 25↑ | 74.0 | 0.0% | 0.0% |
| 19 | ▼1 | Seattle Mariners American League West | 76-86 | -58 | 6-4 | 1488-2 | 23 | 76.0 | 0.0% | 0.0% |
| 20 | ▲1 | Cincinnati Reds National League Central | 75-87 | -160 | 4-6 | 1487+2 | 24 | 75.0 | 0.0% | 0.0% |
| 21 | ▼1 | Detroit Tigers American League Central | 76-86 | +71 | 4-6 | 1486-1 | 22 | 76.0 | 0.0% | 0.0% |
| 22 | ▲1 | Chicago White Sox American League Central | 84-78 | +56 | 7-3 | 1485+3 | 12↓ | 84.0 | 100.0% | 1.4% |
| 23 | ▼1 | St. Louis Cardinals National League Central | 77-85 | -29 | 2-8 | 1479-6 | 20 | 77.0 | 0.0% | 0.0% |
| 24 | — | Minnesota Twins American League Central | 77-85 | -58 | 6-4 | 1475+4 | 21 | 77.0 | 0.0% | 0.0% |
| 25 | ▲1 | Washington Nationals National League East | 77-85 | +6 | 6-4 | 1474+5 | 19↓ | 77.0 | 0.0% | 0.0% |
| 26 | ▼1 | Kansas City Royals American League Central | 69-93 | -120 | 2-8 | 1467-4 | 26 | 69.0 | 0.0% | 0.0% |
| 27 | — | San Francisco Giants National League West | 65-97 | -91 | 2-8 | 1453-7 | 27 | 65.0 | 0.0% | 0.0% |
| 28 | — | Athletics American League West | 64-98 | -238 | 3-7 | 1441+1 | 28 | 64.0 | 0.0% | 0.0% |
| 29 | — | Los Angeles Angels American League West | 62-100 | -97 | 4-6 | 1432-2 | 29 | 62.0 | 0.0% | 0.0% |
| 30 | — | Colorado Rockies National League West | 58-104 | -192 | 2-8 | 1403-5 | 30 | 58.0 | 0.0% | 0.0% |
Where the model disagrees with the standings
- Chicago White Sox 84-78 — #12 in the standings, #22 here (+56 runs, Elo 1485). The record flatters them.
- New York Mets 74-88 — #25 in the standings, #18 here (-32 runs, Elo 1490). The record understates them.
- Toronto Blue Jays 79-83 — #18 in the standings, #12 here (-46 runs, Elo 1507). The record understates them.
MLBMLB Lineup of the Week — Sep 21 – Sep 27
Sep 21–Sep 27 · 90 gamesOne player per position — the best Monday-to-Sunday week at the position each player played most: hitters by a DraftKings-style line score, starters by game score, relievers on the same scale over short outings. Straight from the box scores — nothing here is a pick or a projection.







Division Players of the Week
| Division | Hitter | Pitcher |
|---|---|---|
| AL Central | Luke Keaschall MIN 8-for-21 (.381), 1 HR, 6 RBI, 10 R, 1 SB |  Joe Ryan MIN 1 GS, 6.0 IP, 8 K, 3.00 ERA, 1-0 |
| AL East | Pete Alonso BAL 7-for-18 (.389), 5 HR, 8 RBI, 8 R |  Max Scherzer TOR 2 GS, 12.0 IP, 14 K, 3.75 ERA, 1-1 |
| AL West | Lucas Spence HOU 6-for-18 (.333), 4 HR, 9 RBI, 5 R |  Miguel Ullola HOU 3 G, 6.0 IP, 6 K, 0.00 ERA |
| NL Central | Brice Turang MIL 9-for-25 (.360), 2 HR, 7 RBI, 5 R | Jared Jones PIT 2 GS, 11.0 IP, 14 K, 0.00 ERA, 1-0 |
| NL East |  Bryson Stott PHI 9-for-19 (.474), 0 HR, 2 RBI, 4 R, 2 SB |  Zack Wheeler PHI 2 GS, 11.2 IP, 16 K, 3.09 ERA, 1-0 |
| NL West | Nolan Arenado AZ 10-for-23 (.435), 3 HR, 8 RBI, 7 R |  Michael Soroka AZ 2 GS, 11.2 IP, 13 K, 3.09 ERA, 1-0 |
NHLNHL Power Rankings — Oct 29
213 games · updated Oct 30Movement is versus seven days ago: the same rating re-run with those results removed. Rec # is where the standings put the team; a gap between that and the rank is the model disagreeing with the table.
| # | Δ | Team | Record | GD | Last 10 | Elo | Rec # | Proj Pts | Playoffs | Stanley Cup |
|---|---|---|---|---|---|---|---|---|---|---|
| 1 | — | Carolina Hurricanes Metropolitan | 11-2-2 | +20 | 8-1-1 | 1577+11 | 1 | 111.2 | 93.2% | 12.2%+2.0 |
| 2 | ▲1 | Colorado Avalanche Central | 7-5-1 | +12 | 5-4-1 | 1562+2 | 15↑ | 103.5 | 85.4% | 9.1%-1.0 |
| 3 | ▼1 | Tampa Bay Lightning Atlantic | 8-3-1 | +6 | 7-2-1 | 1556-5 | 3 | 104.9 | 79.4% | 7.4%-0.5 |
| 4 | — | Dallas Stars Central | 7-5-1 | +5 | 6-3-1 | 1543-10 | 16↑ | 100.7 | 77.1% | 6.2%-1.5 |
| 5 | ▲5 | Montréal Canadiens Atlantic | 8-3-2 | +5 | 7-2-1 | 1541+19 | 5 | 102.6 | 73.0% | 5.3%+1.6 |
| 6 | ▲2 | Minnesota Wild Central | 9-3-3 | +12 | 6-2-2 | 1537+9 | 4 | 103.9 | 85.5% | 6.2%+1.5 |
| 7 | ▲4 | Washington Capitals Metropolitan | 8-4-0 | +6 | 7-3 | 1533+11 | 8 | 100.7 | 70.2% | 4.7%+1.0 |
| 8 | ▲1 | Buffalo Sabres Atlantic | 6-4-3 | -7 | 4-3-3 | 1529+4 | 18↑ | 97.7 | 57.0% | 3.8%+0.8 |
| 9 | ▼3 | Boston Bruins Atlantic | 9-4-1 | +18 | 7-2-1 | 1529-5 | 6 | 100.6 | 67.7% | 4.4%-0.8 |
| 10 | ▼5 | Edmonton Oilers Pacific | 9-2-2 | +13 | 7-2-1 | 1528-8 | 2↓ | 103.3 | 86.1% | 5.5%-1.4 |
| 11 | ▼4 | Ottawa Senators Atlantic | 8-5-1 | 0 | 5-4-1 | 1527-5 | 14 | 97.7 | 57.3% | 3.6%-0.6 |
| 12 | — | Utah Mammoth Central | 9-5-0 | +5 | 6-4 | 1524+3 | 10 | 100.0 | 76.1% | 4.2% |
| 13 | — | Vegas Golden Knights Pacific | 9-4-1 | +12 | 6-3-1 | 1521+1 | 7↓ | 100.2 | 79.2% | 4.9% |
| 14 | ▲1 | New Jersey Devils Metropolitan | 8-5-0 | +5 | 7-3 | 1508+7 | 11 | 95.2 | 51.6% | 2.4% |
| 15 | ▼1 | St. Louis Blues Central | 6-6-1 | +1 | 5-4-1 | 1503-5 | 22↑ | 92.8 | 52.5% | 2.4% |
| 16 | ▲2 | Florida Panthers Atlantic | 7-4-2 | +2 | 6-4 | 1503+10 | 13 | 94.7 | 46.5% | 2.1% |
| 17 | ▲2 | New York Islanders Metropolitan | 7-4-2 | +5 | 6-2-2 | 1496+5 | 12↓ | 93.4 | 44.4% | 1.8% |
| 18 | ▼1 | Pittsburgh Penguins Metropolitan | 5-6-2 | -1 | 3-5-2 | 1493-1 | 24↑ | 89.5 | 31.3% | 1.4% |
| 19 | ▲1 | Columbus Blue Jackets Metropolitan | 5-6-0 | -8 | 4-6 | 1491+5 | 25↑ | 89.2 | 30.4% | 1.4% |
| 20 | ▼4 | New York Rangers Metropolitan | 7-6-1 | +2 | 4-5-1 | 1485-10 | 19 | 89.8 | 32.6% | 1.2%-0.8 |
| 21 | ▲2 | Detroit Red Wings Atlantic | 6-4-3 | -1 | 5-2-3 | 1484+3 | 17 | 89.7 | 29.2% | 1.0% |
| 22 | ▲2 | Seattle Kraken Pacific | 8-4-1 | +4 | 6-3-1 | 1476-2 | 9↓ | 92.9 | 56.9% | 1.5% |
| 23 | ▲5 | Los Angeles Kings Pacific | 4-6-2 | -8 | 4-5-1 | 1474+2 | 28↑ | 87.3 | 36.0% | 1.3% |
| 24 | ▲2 | Toronto Maple Leafs Atlantic | 7-6-2 | +5 | 5-4-1 | 1474-1 | 21 | 88.0 | 23.9% | 0.7% |
| 25 | — | Anaheim Ducks Pacific | 5-7-1 | -7 | 3-6-1 | 1471-4 | 26 | 85.9 | 31.5% | 1.0% |
| 26 | ▼4 | Philadelphia Flyers Metropolitan | 3-8-4 | -22 | 3-5-2 | 1471-12 | 30 | 82.2 | 12.4% | 0.5%-0.5 |
| 27 | ▼6 | Winnipeg Jets Central | 4-6-3 | -10 | 2-6-2 | 1471-13 | 27 | 85.8 | 27.9% | 0.9%-0.7 |
| 28 | ▼1 | Nashville Predators Central | 4-4-5 | -6 | 3-3-4 | 1469-4 | 23↓ | 87.4 | 32.6% | 0.9% |
| 29 | — | San Jose Sharks Pacific | 7-6-1 | -7 | 4-5-1 | 1461-5 | 20↓ | 87.8 | 37.7% | 0.8% |
| 30 | — | Calgary Flames Pacific | 5-7-0 | -17 | 5-5 | 1461+6 | 29 | 84.3 | 27.6% | 0.8% |
| 31 | — | Chicago Blackhawks Central | 4-9-0 | -21 | 4-6 | 1414-7 | 31 | 74.0 | 5.2% | 0.1% |
| 32 | — | Vancouver Canucks Pacific | 3-11-1 | -23 | 1-8-1 | 1399-1 | 32 | 69.9 | 2.8% | 0.1% |
NBANBA Power Rankings — Oct 29
71 games · updated Oct 30Movement is versus seven days ago: the same rating re-run with those results removed. Rec # is where the standings put the team; a gap between that and the rank is the model disagreeing with the table.
| # | Δ | Team | Record | PD | Last 10 | Elo | Rec # | Proj W | Playoffs | NBA title |
|---|---|---|---|---|---|---|---|---|---|---|
| 1 | — | Oklahoma City Thunder Northwest | 4-1 | +18 | 4-1 | 1645-26 | 5 | 56.5 | 95.7% | 16.3%-5.6 |
| 2 | — | San Antonio Spurs Southwest | 3-2 | +33 | 3-2 | 1637+6 | 11↑ | 54.8 | 94.0% | 13.8%+3.1 |
| 3 | — | New York Knicks Atlantic | 2-3 | +1 | 2-3 | 1615-8 | 18↑ | 52.0 | 89.6% | 11.1%+0.5 |
| 4 | ▲5 | Detroit Pistons Central | 4-1 | +32 | 4-1 | 1584+23 | 4 | 51.3 | 87.8% | 6.4%+1.2 |
| 5 | ▼1 | Philadelphia 76ers Atlantic | 4-1 | +17 | 4-1 | 1582-6 | 6 | 50.7 | 86.5% | 6.1%-0.7 |
| 6 | ▼1 | Toronto Raptors Atlantic | 3-1 | +60 | 3-1 | 1581+5 | 7 | 49.6 | 84.1% | 6.3% |
| 7 | ▲1 | Los Angeles Lakers Pacific | 4-1 | +48 | 4-1 | 1580+8 | 3 | 50.5 | 85.6% | 5.9% |
| 8 | ▼2 | Cleveland Cavaliers Central | 3-2 | +5 | 3-2 | 1578+3 | 13↑ | 49.0 | 82.6% | 5.9%+0.8 |
| 9 | ▲2 | Boston Celtics Atlantic | 3-1 | +32 | 3-1 | 1571+18 | 9 | 48.9 | 82.1% | 5.1%+1.0 |
| 10 | ▲4 | Houston Rockets Southwest | 5-0 | +71 | 5-0 | 1570+42 | 1↓ | 50.7 | 85.1% | 5.0%+2.2 |
| 11 | ▼4 | Portland Trail Blazers Northwest | 3-1 | +35 | 3-1 | 1556-18 | 8 | 47.0 | 75.9% | 3.5%-1.9 |
| 12 | ▲3 | Minnesota Timberwolves Northwest | 3-2 | +63 | 3-2 | 1551+23 | 10 | 46.5 | 74.6% | 3.2% |
| 13 | ▼3 | Denver Nuggets Northwest | 2-2 | -13 | 2-2 | 1544-17 | 16 | 45.3 | 70.5% | 3.0%-1.0 |
| 14 | ▼1 | Orlando Magic Southeast | 1-3 | -50 | 1-3 | 1520-23 | 23↑ | 42.4 | 59.8% | 1.7% |
| 15 | ▼3 | Charlotte Hornets Southeast | 3-2 | -36 | 3-2 | 1508-39 | 14 | 42.4 | 59.1% | 1.7% |
| 16 | — | Atlanta Hawks Southeast | 3-3 | +28 | 3-3 | 1504+15 | 15 | 42.4 | 59.4% | 1.4%-1.0 |
| 17 | ▲3 | Dallas Mavericks Southwest | 3-2 | +10 | 3-2 | 1494+47 | 12↓ | 41.3 | 54.0% | 1.0% |
| 18 | — | Phoenix Suns Pacific | 1-2 | -43 | 1-2 | 1470+3 | 21 | 38.2 | 41.3% | 0.5% |
| 19 | ▼2 | Miami Heat Southeast | 1-4 | -39 | 1-4 | 1468-9 | 25↑ | 36.6 | 36.7% | 0.5% |
| 20 | ▲1 | Golden State Warriors Pacific | 2-3 | -9 | 2-3 | 1456+26 | 19 | 36.7 | 35.4% | 0.4% |
| 21 | ▲5 | Memphis Grizzlies Southwest | 5-0 | +60 | 5-0 | 1451+56 | 2↓ | 38.7 | 41.4% | 0.4% |
| 22 | ▼3 | Indiana Pacers Central | 2-3 | +1 | 2-3 | 1448-14 | 17↓ | 35.6 | 32.1% | 0.3% |
| 23 | ▼1 | New Orleans Pelicans Southwest | 1-4 | -11 | 1-4 | 1411-9 | 24 | 30.7 | 16.1% | 0.1% |
| 24 | ▼1 | Los Angeles Clippers Pacific | 1-3 | -6 | 1-3 | 1396-14 | 22 | 30.5 | 15.7% | 0.1% |
| 25 | ▼1 | Utah Jazz Northwest | 1-4 | -39 | 1-4 | 1393-13 | 26 | 29.3 | 12.5% | 0.1% |
| 26 | ▼1 | Milwaukee Bucks Central | 1-4 | -54 | 1-4 | 1386-18 | 27 | 28.6 | 11.5% | 0.1% |
| 27 | — | Chicago Bulls Central | 1-4 | -81 | 1-4 | 1380-11 | 28 | 28.1 | 10.8% | 0.1% |
| 28 | ▲1 | Washington Wizards Southeast | 2-3 | -11 | 2-3 | 1373-5 | 20↓ | 28.4 | 10.8% | 0.1% |
| 29 | ▼1 | Brooklyn Nets Atlantic | 0-4 | -39 | 0-4 | 1363-22 | 29 | 25.8 | 7.1% | 0.0% |
| 30 | — | Sacramento Kings Pacific | 0-5 | -83 | 0-5 | 1314-25 | 30 | 21.2 | 2.3% | 0.0% |
How to read this
Elo
1500 is league average. A 100-point gap is roughly a 64% favourite on a neutral field. The NFL rating is margin-weighted and damped for expected results — a blowout by a heavy favourite moves it less than an upset. NFL, MLB and NHL revert a third of the way to average each offseason and the NBA 40% (fit on five NBA seasons), which is why an early-season table still carries last year.
Movement
Not read off a saved copy of last week's table. The rating is rebuilt with the window's results removed and ranked again, so every arrow is attributable to specific games. Elo is zero-sum: what one team gains its opponent loses.
This is not a pick
A ranking says who has been better. A game pick needs the matchup, the venue, the starter, the week's injuries. Those live on the game pages, and only those are graded.
Graded Record
Rankings settle nothing, so there is no hit rate here. The game-by-game record is on the performance page, losses included.
Predictions are for informational purposes only. Please gamble responsibly.